London flood map shows areas of city at risk of being underwater
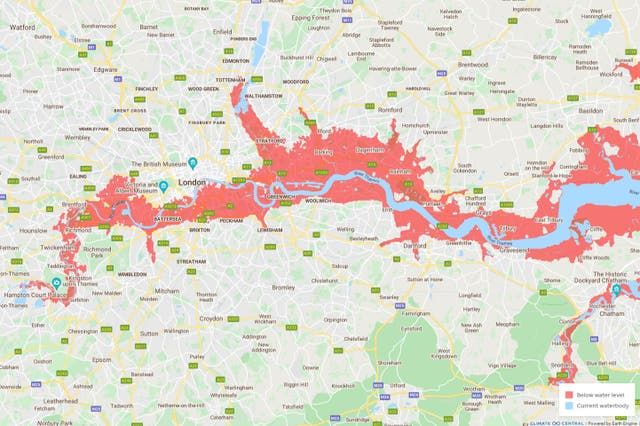
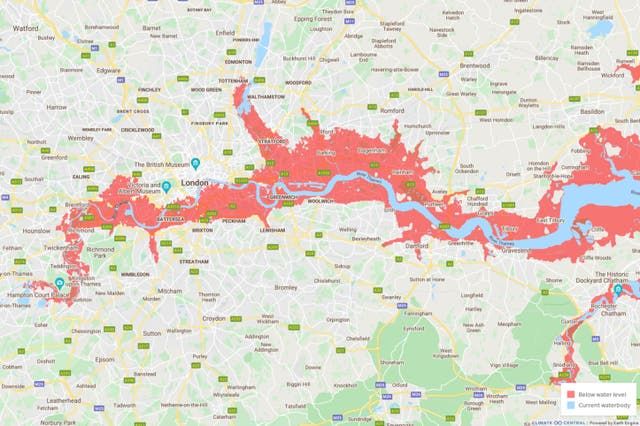
The image showed the entire bank of the River Thames could be at risk — with the exception of Westminster, Soho and the City of London — as extreme weather becomes more frequent due to climate change.
Other vulnerable areas include the majority of east London — including Stratford, Canary Wharf and the Royal Docklands.
In south London, areas above Clapham and Brixton could also at risk as well as the west London river bank such as Fulham, Hammersmith and Richmond.
North and north west London appeared to be least at risk, with possible flood zones stretching from Tottenham to Hackney only.
The map was created using a new NASA tool to give snapshots of rising sea levels in the coming decades.
 London flood risk map 2030
Last week, London was flooded for a third time within weeks.
Torrential rain and thunderstorms brought flooding and travel disruption to the capital where cars were seen driving along waterlogged roads in Tooting and Battersea.
Experts have warned climate change is likely behind the rise in severe weather conditions.
NASA’s sea level projection tool was released using data from the Intergovernmental Panel on Climate Change (IPCC).
Users can pull up the tool’s layers of maps, click anywhere on the global ocean and coastlines, and pick any decade between 2020 and 2150.
 Minor changes can be seen in the London flood risk map for 2050
The technology was based on the projections in the IPCC’s Sixth Assessment Report, released on August 9.
It also enables users to focus on the effects of different processes drive sea level rise such as the melting of ice sheets and glaciers.
This also includes the extent to which ocean waters shift their circulation patterns or expand as they warm which can affect the height of the ocean.
“As communities across the country prepare for the impacts of sea level rise, access to good, clear data is key to helping save lives and livelihoods,” said NASA Administrator Bill Nelson.


